Overview
The Overview is the home page of Opticks. It is intended to show an overall view of your invalid traffic and the impact of Opticks. To accomplish this, the Overview page displays four sections: the kpis, the trends, the watchlist and the channels. Each one explained below.
KPI's
At the top of the page, the KPI's for the selected period (defaults to last week) are shown, including:
- Legitimate traffic: the total amount of legitimate sessions analysed by Opticks
- Invalid traffic: the total amount of invalid sessions analysed by Opticks
- Savings: the economic impact of Opticks preventive actions caused by your invalid traffic in your integrated paid channels
Each one of these metrics is compared to the previous period, calculated as the previous time range with the same amount of days, and displays either the improvement or worsening of each metric. For example, if days 20 to 30 of a month are selected, these are compared with the previous ten days (days 9 to 19 of the same month).
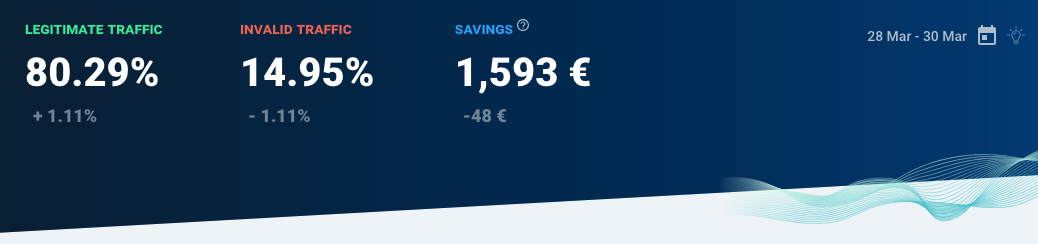
At the right side of the KPI's, there's a date range that is applied to all Overview sections.
Trends
Trends section will show the top most positive and negative trends for a given dimension in the selected time range, compared to the previous time range. That can be used to detect which campaigns, channels, sources or any other available Opticks dimension has improved quality or has been receiving more invalid traffic and requires attention.
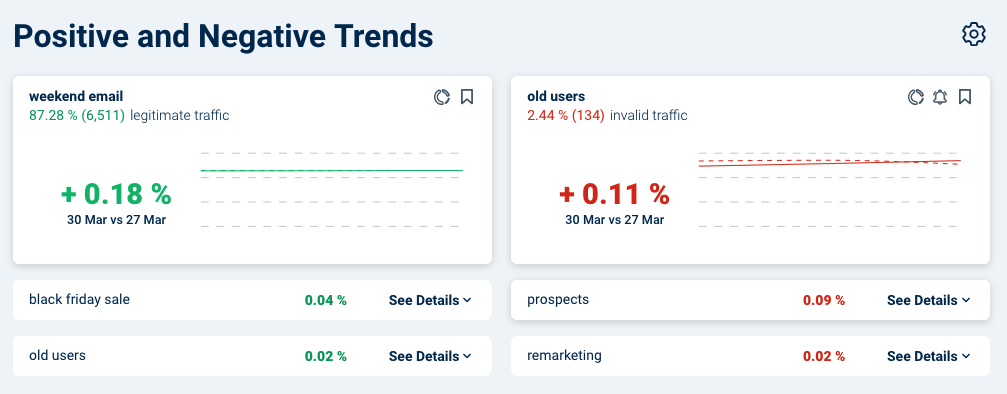
The graphic showing the evolution in the selected period is automatically expanded for each first row, and can be expanded for the other rows by clicking in the See Details text. When not configured, default dimension for Trends is utm_camapign.
Configuring trends
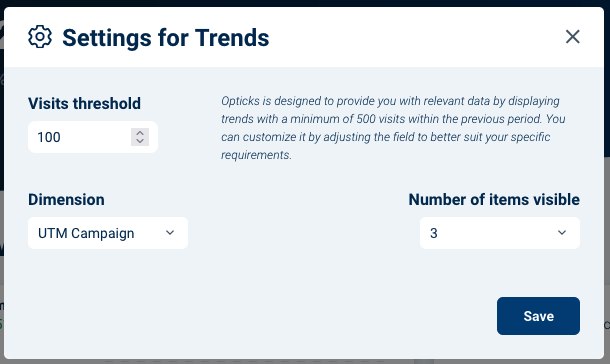
By clicking in the gear icon at the right side of the Trends header, you can configure the following values:
- Visits threshold: the minimum number of visits that the dimension value is required to be included in the trend. Defaults to 500, meaning values with less than 500 visits won't be included in the trends. Intended to avoid outliers with small samples.
- Dimension: the dimension for which you want to see the trends.
- Number of items visible: the number of maximum items for each positive and negative trend you want to see in the Overview.
Watchlist
In the watchlist section, items you have added to the watchlist from the analytics screen will be displayed. You can see how to add items to the watchlist here. You can combine any dimension or group of dimensions, such as a particular country, UTM, or combination of campaign and keyword that you want to keep a close look at.
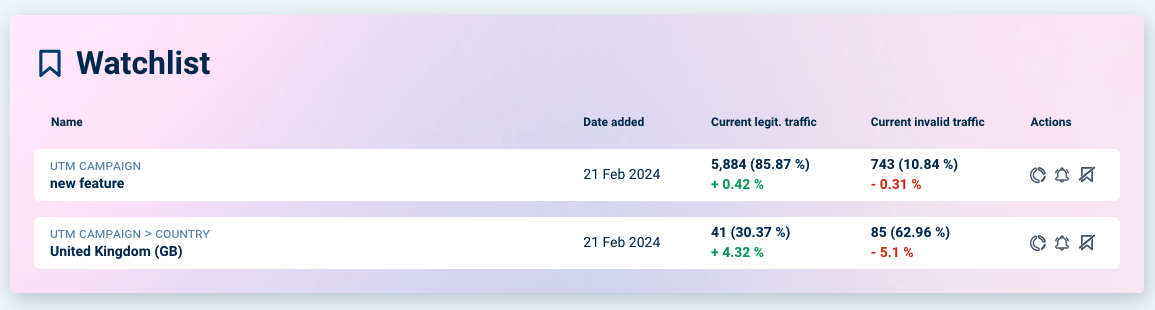
The dimension and values that are watchlisted will be shown one per row, with information about the legitimate and invalid traffic metrics compared to the previous period as in the Trends section. In the Actions column, there are quick links that can be used to go to the Analytics with the item in the filter, create an Alert for that particular item and remove it from the watchlist.
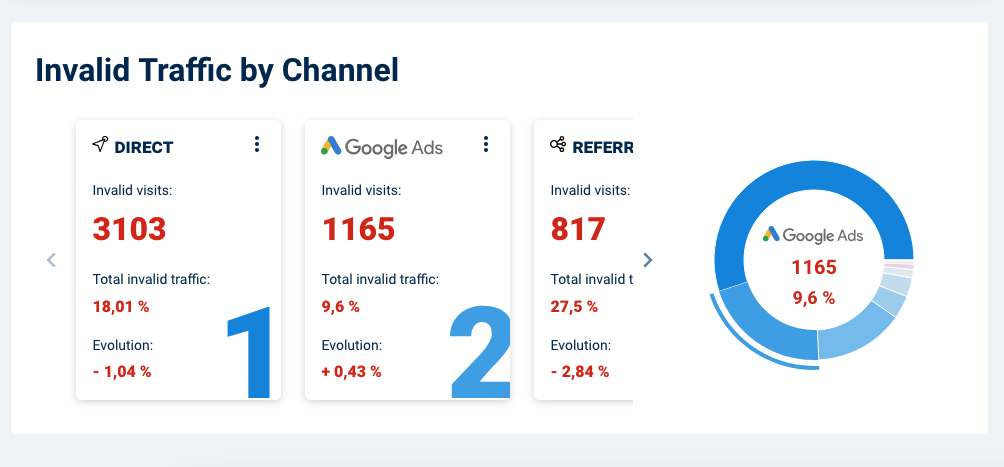
Channels
The channels section show all your traffic channels order by the amount of total invalid visits. It also displays the percentage of invalid traffic in the traffic channel, and the evolution compared to the previous period. In the right side, a donut graphic is displayed visually representing the percentage of your total invalid traffic that is represented by each channel.